4 big infographic prints.
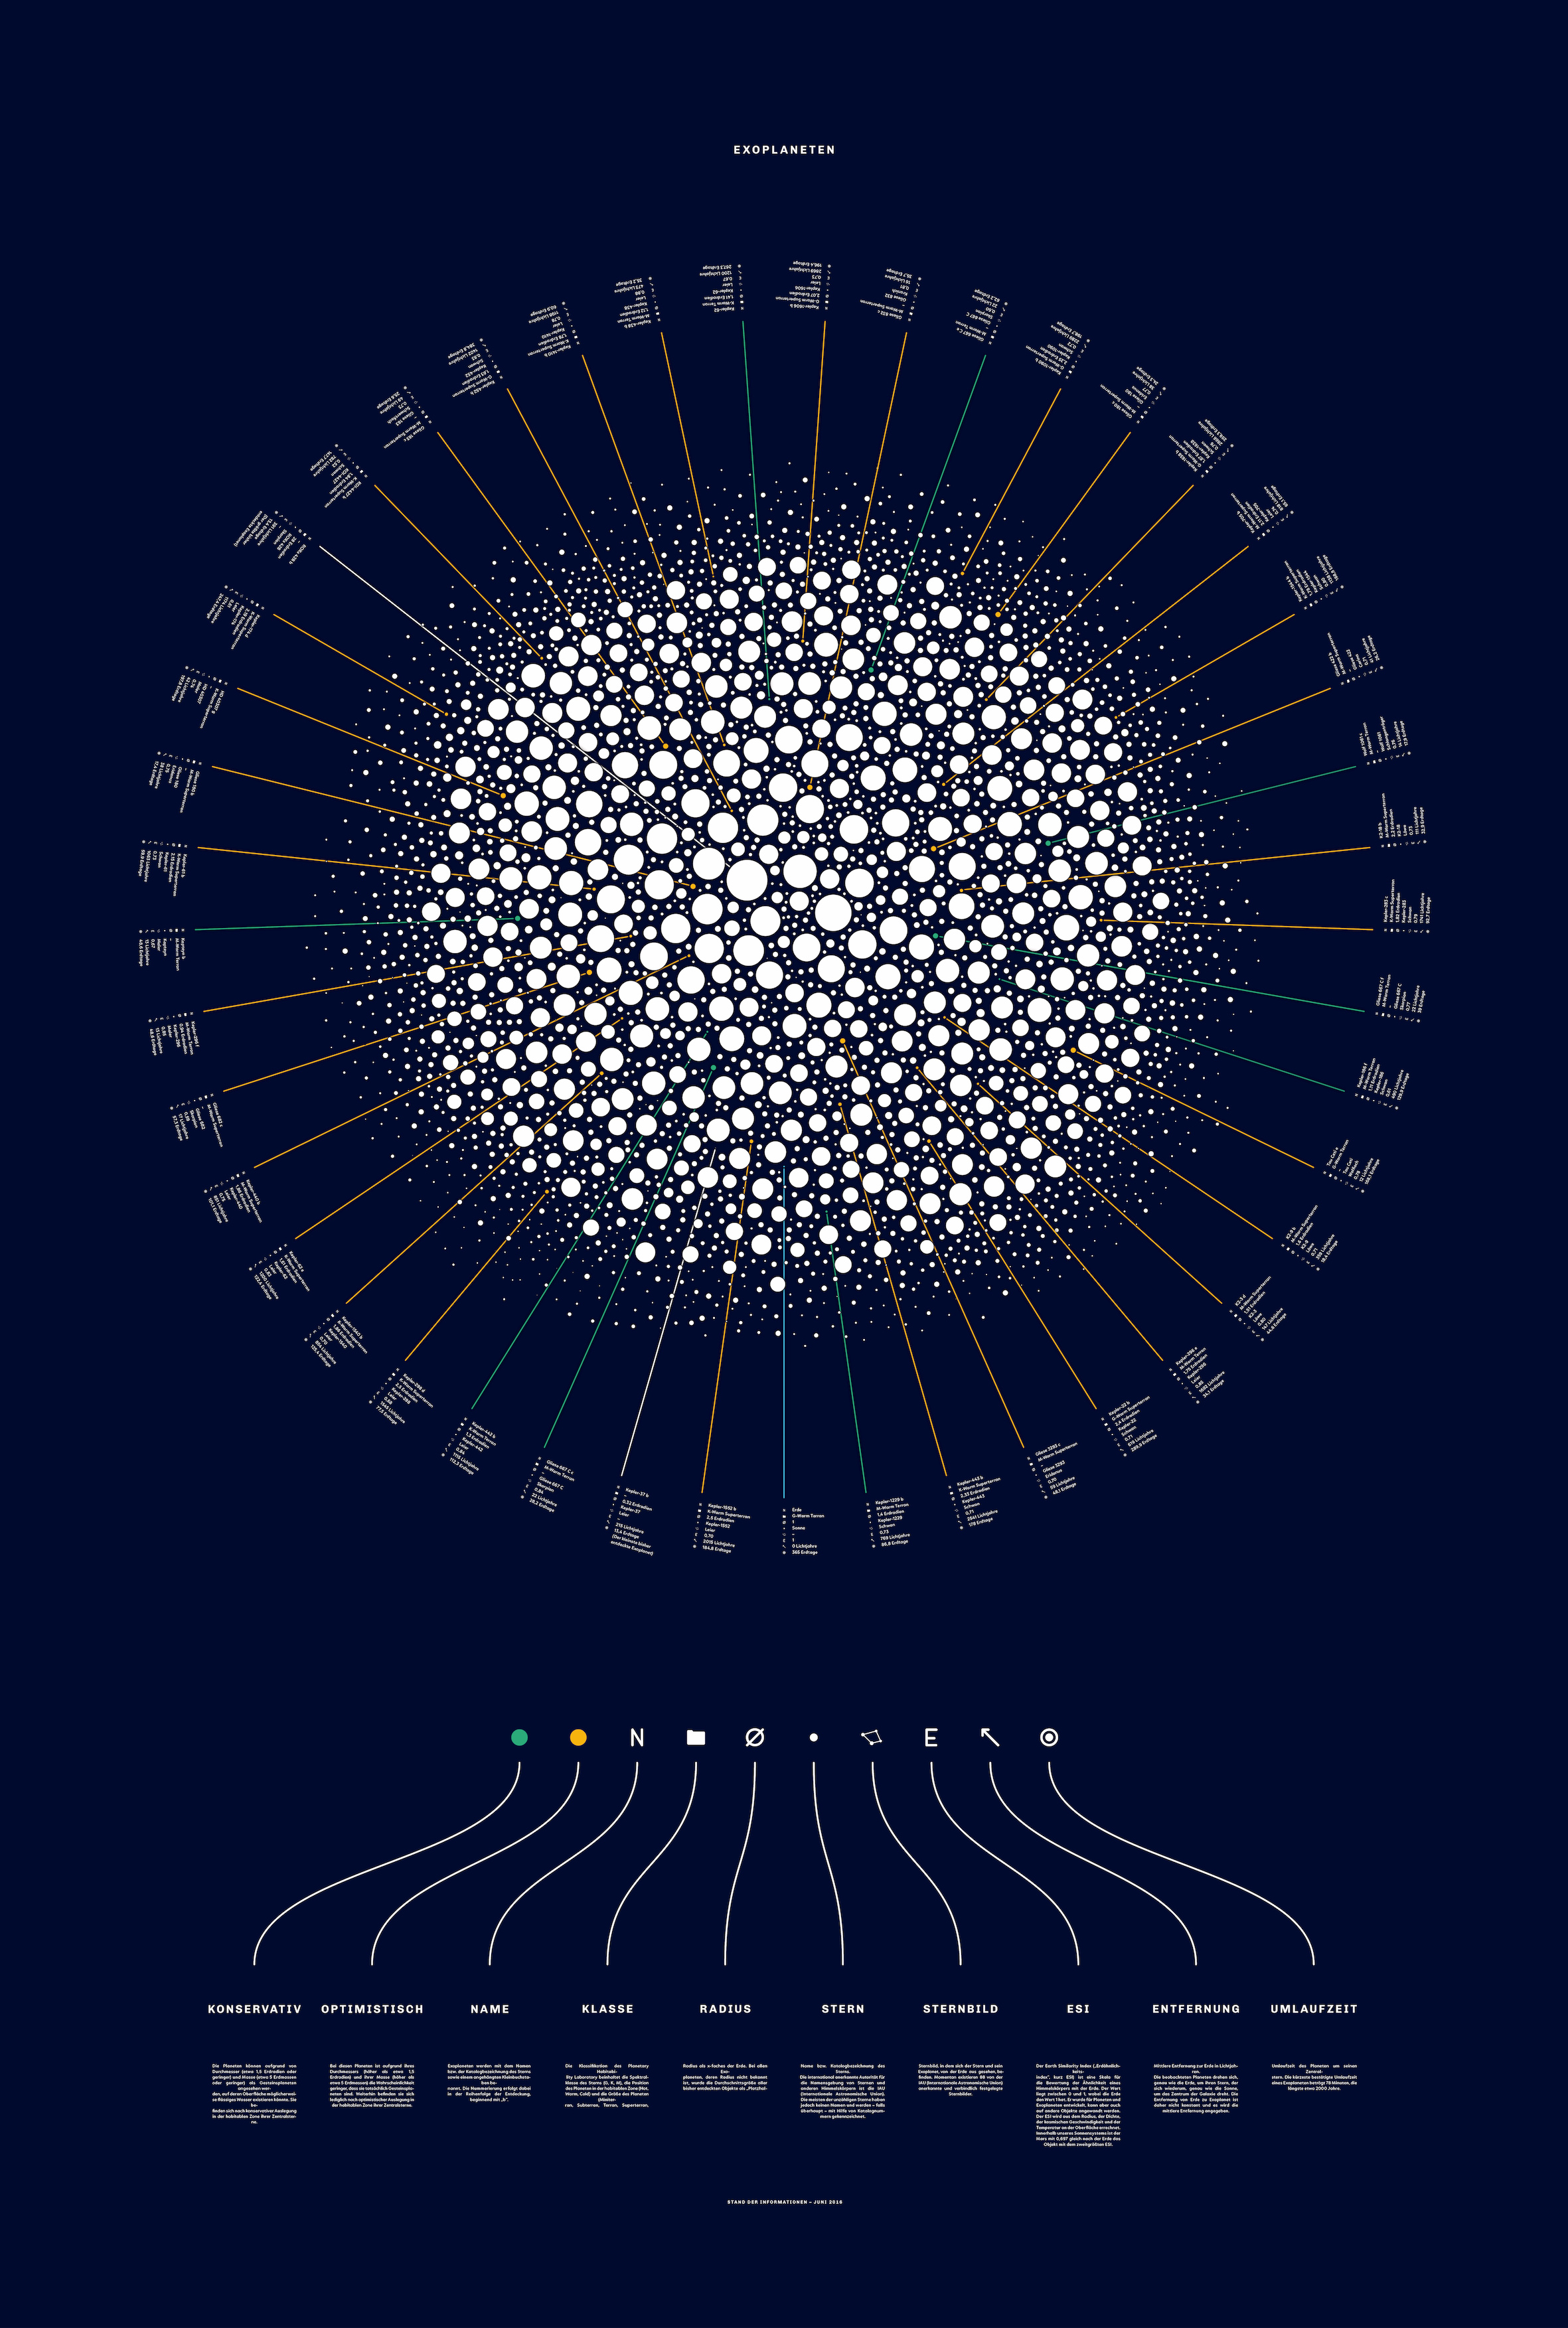
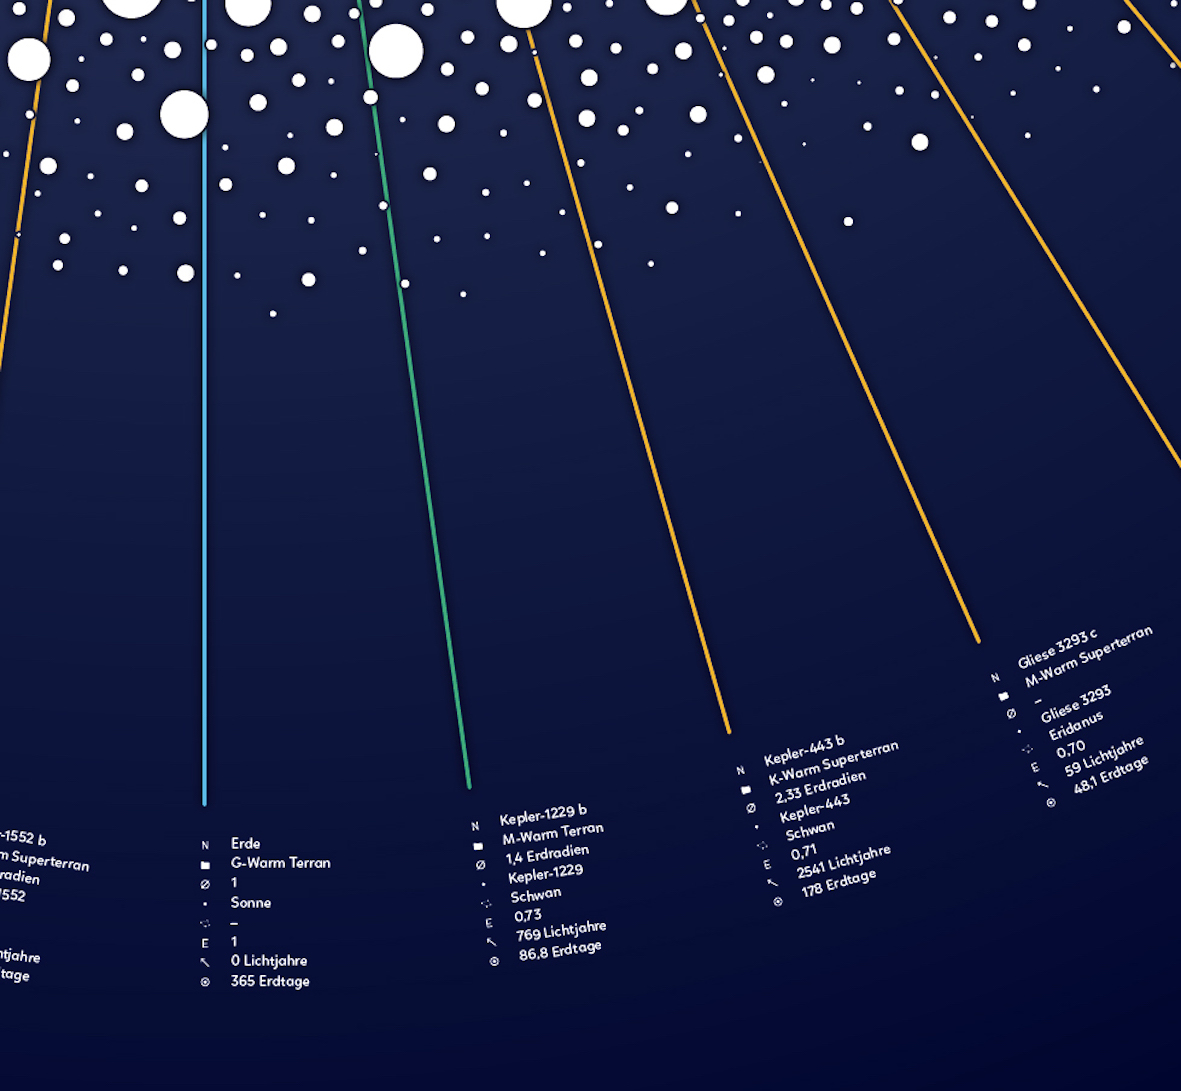
Exoplanets: All 3487 exoplanets, which have been cataloged till may 2016, are pictured to scale. The most remarkables got a brief profile with dates like their interpretation of data (conservative or optimistic), name, class, star, distance and so forth.
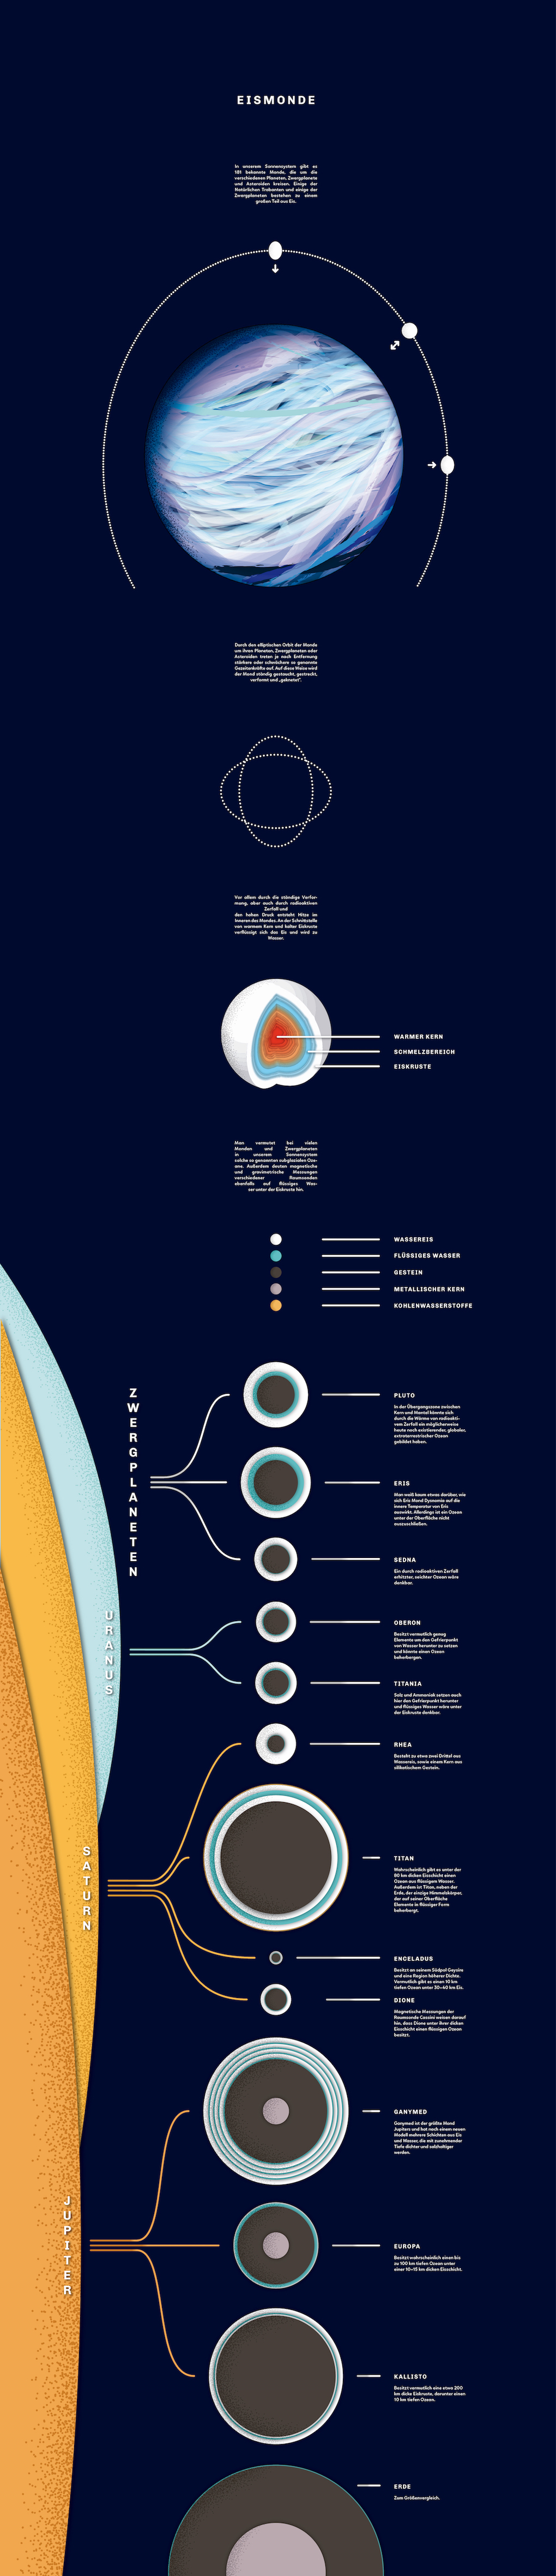
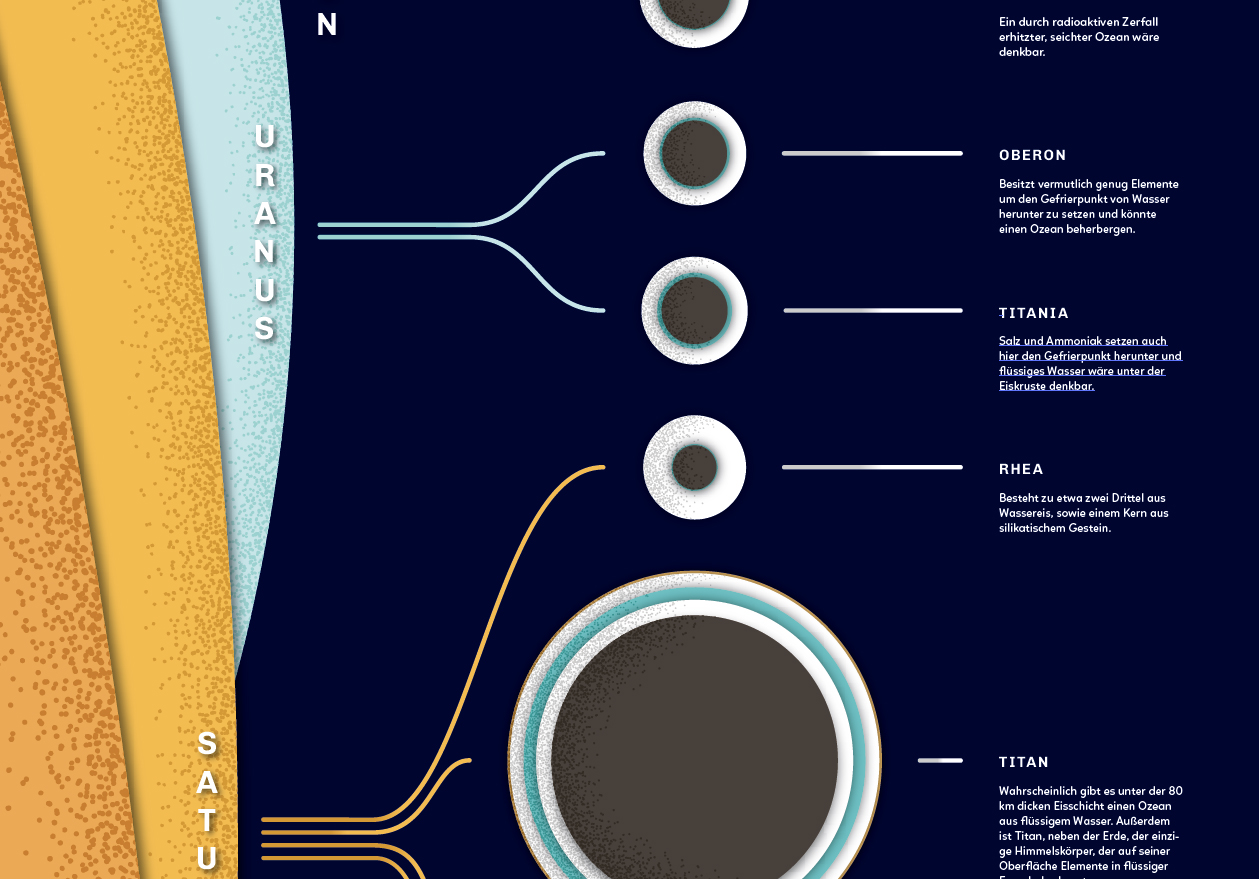
Icy Moons: This graphic illustrates the compression and streching of icy moons and the resulting frictional heat. It gives a quick overview about some celestial bodies in our solar system, which may be hosting subglacial oceans with liquid water and therefore life.
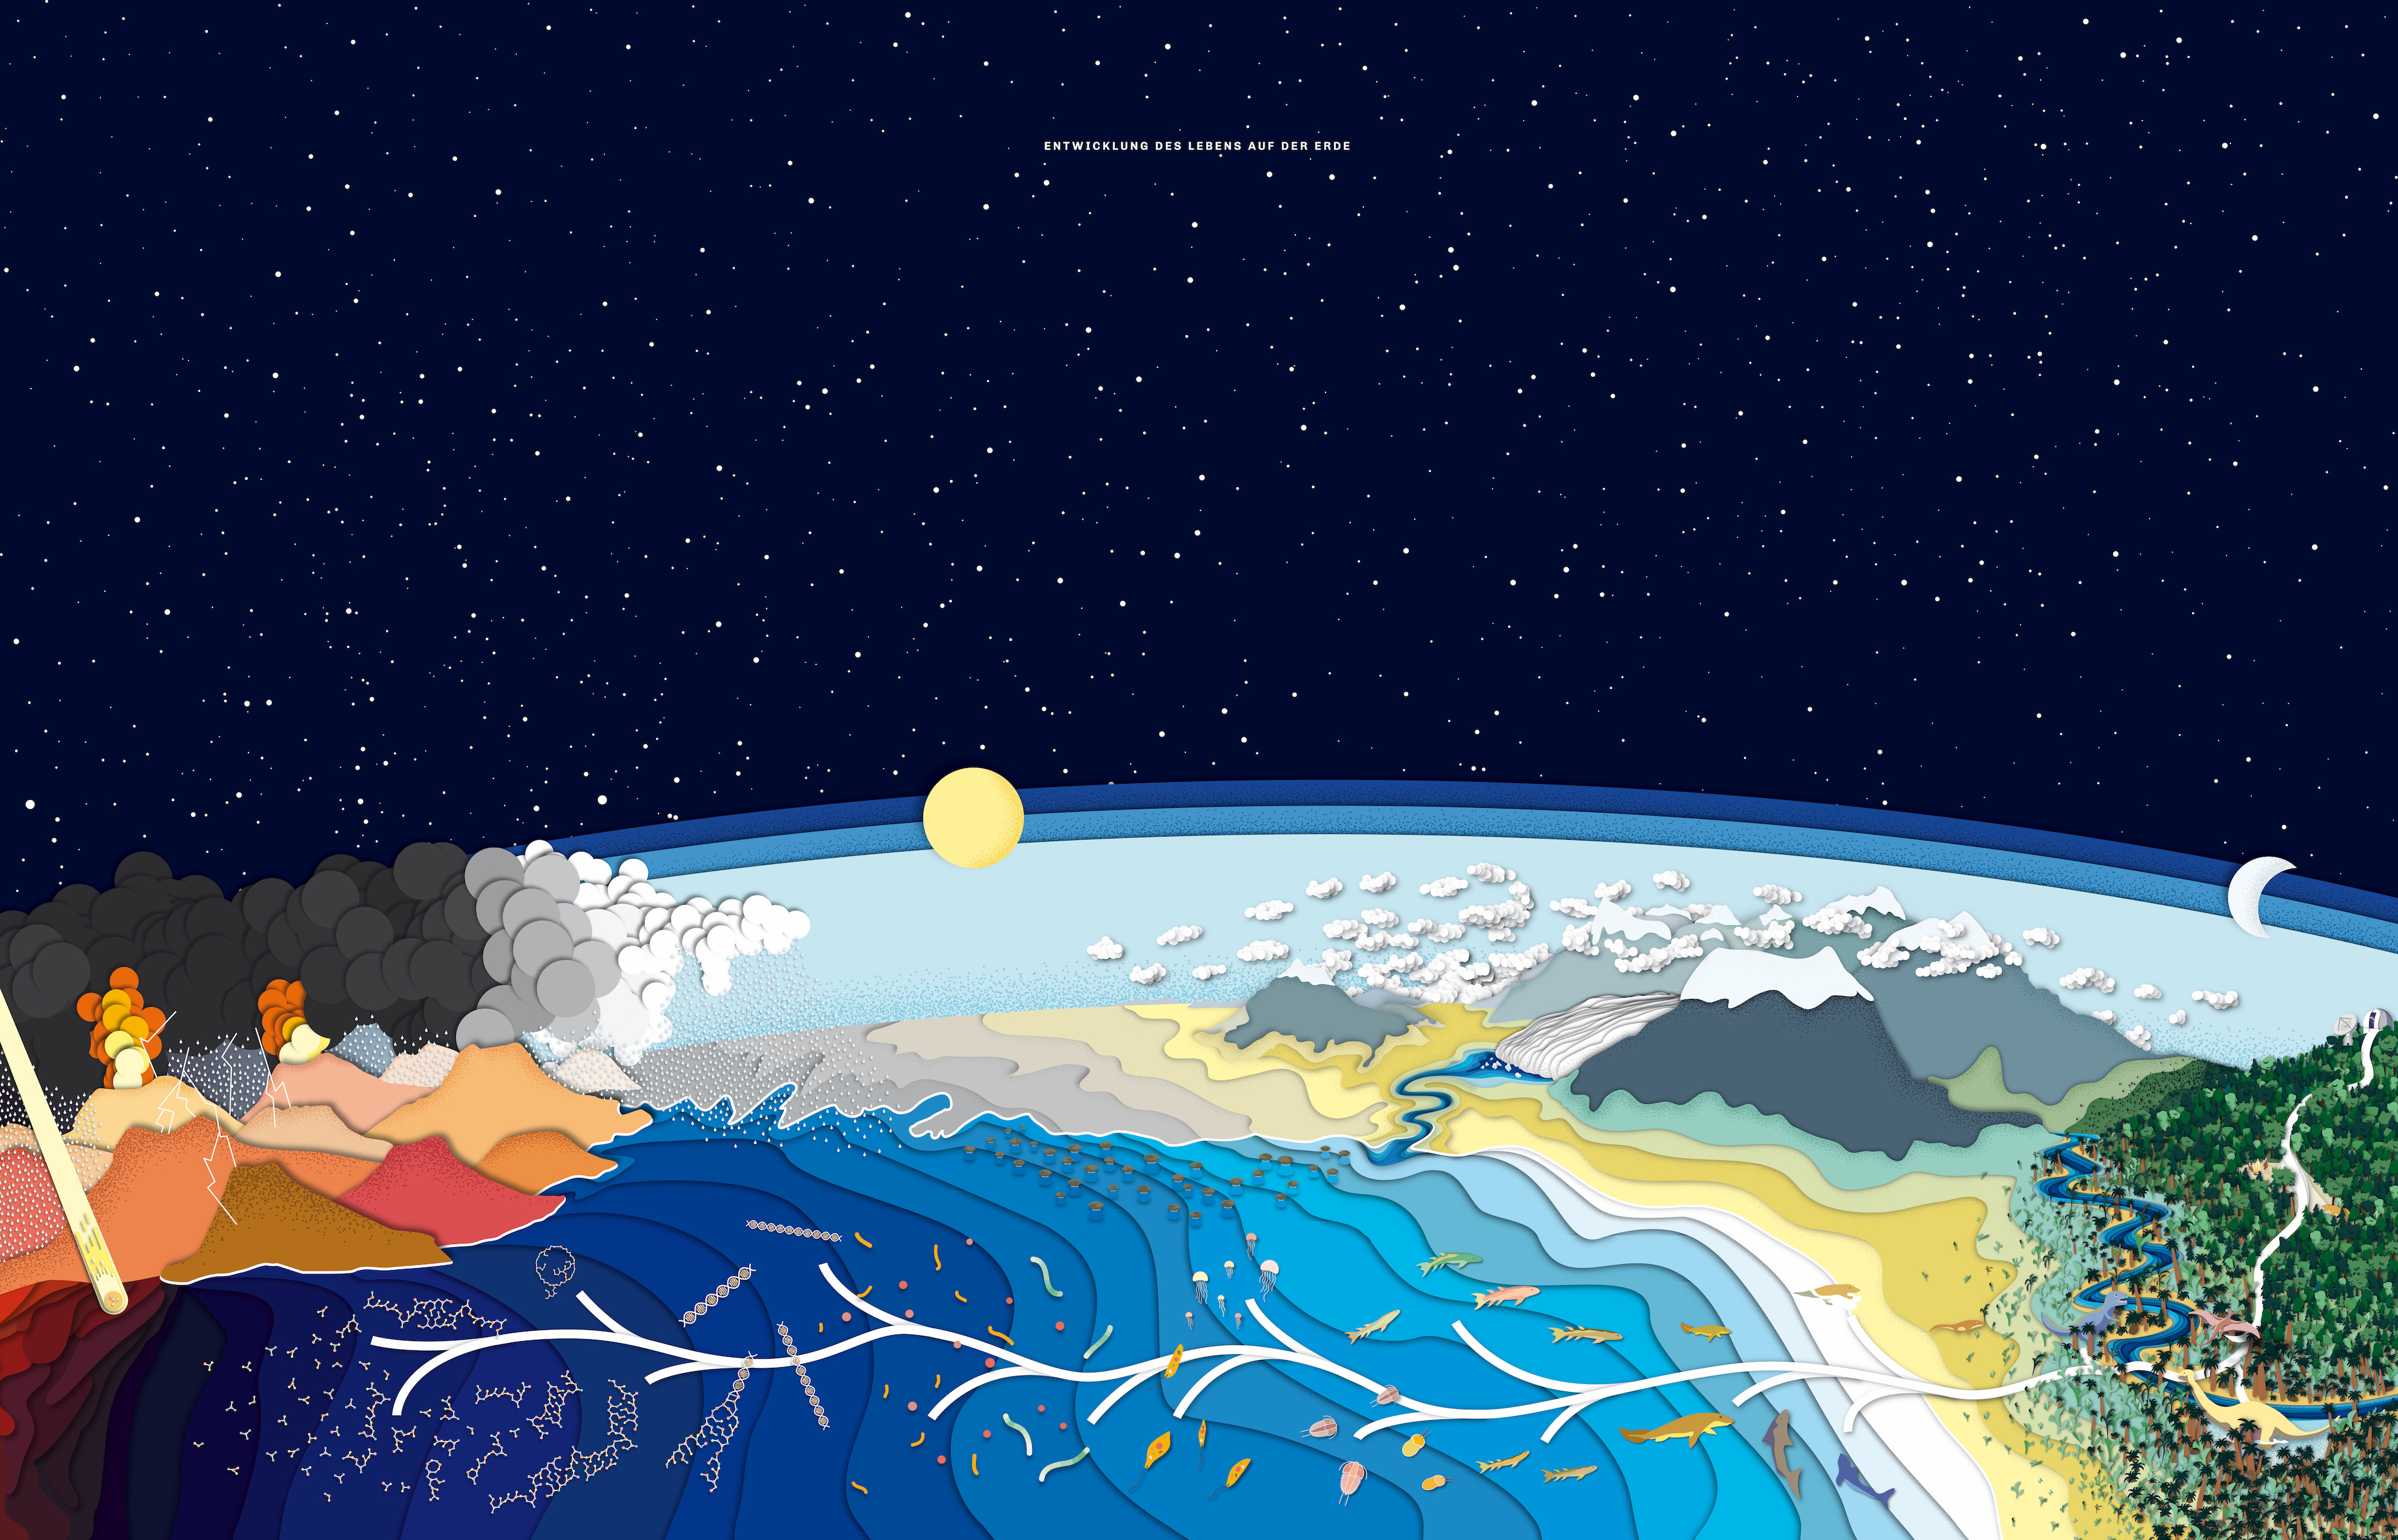
Life on earth: An illustration about the evolution of life on earth from simple organic compounds over multicellular organisms through to modern human.
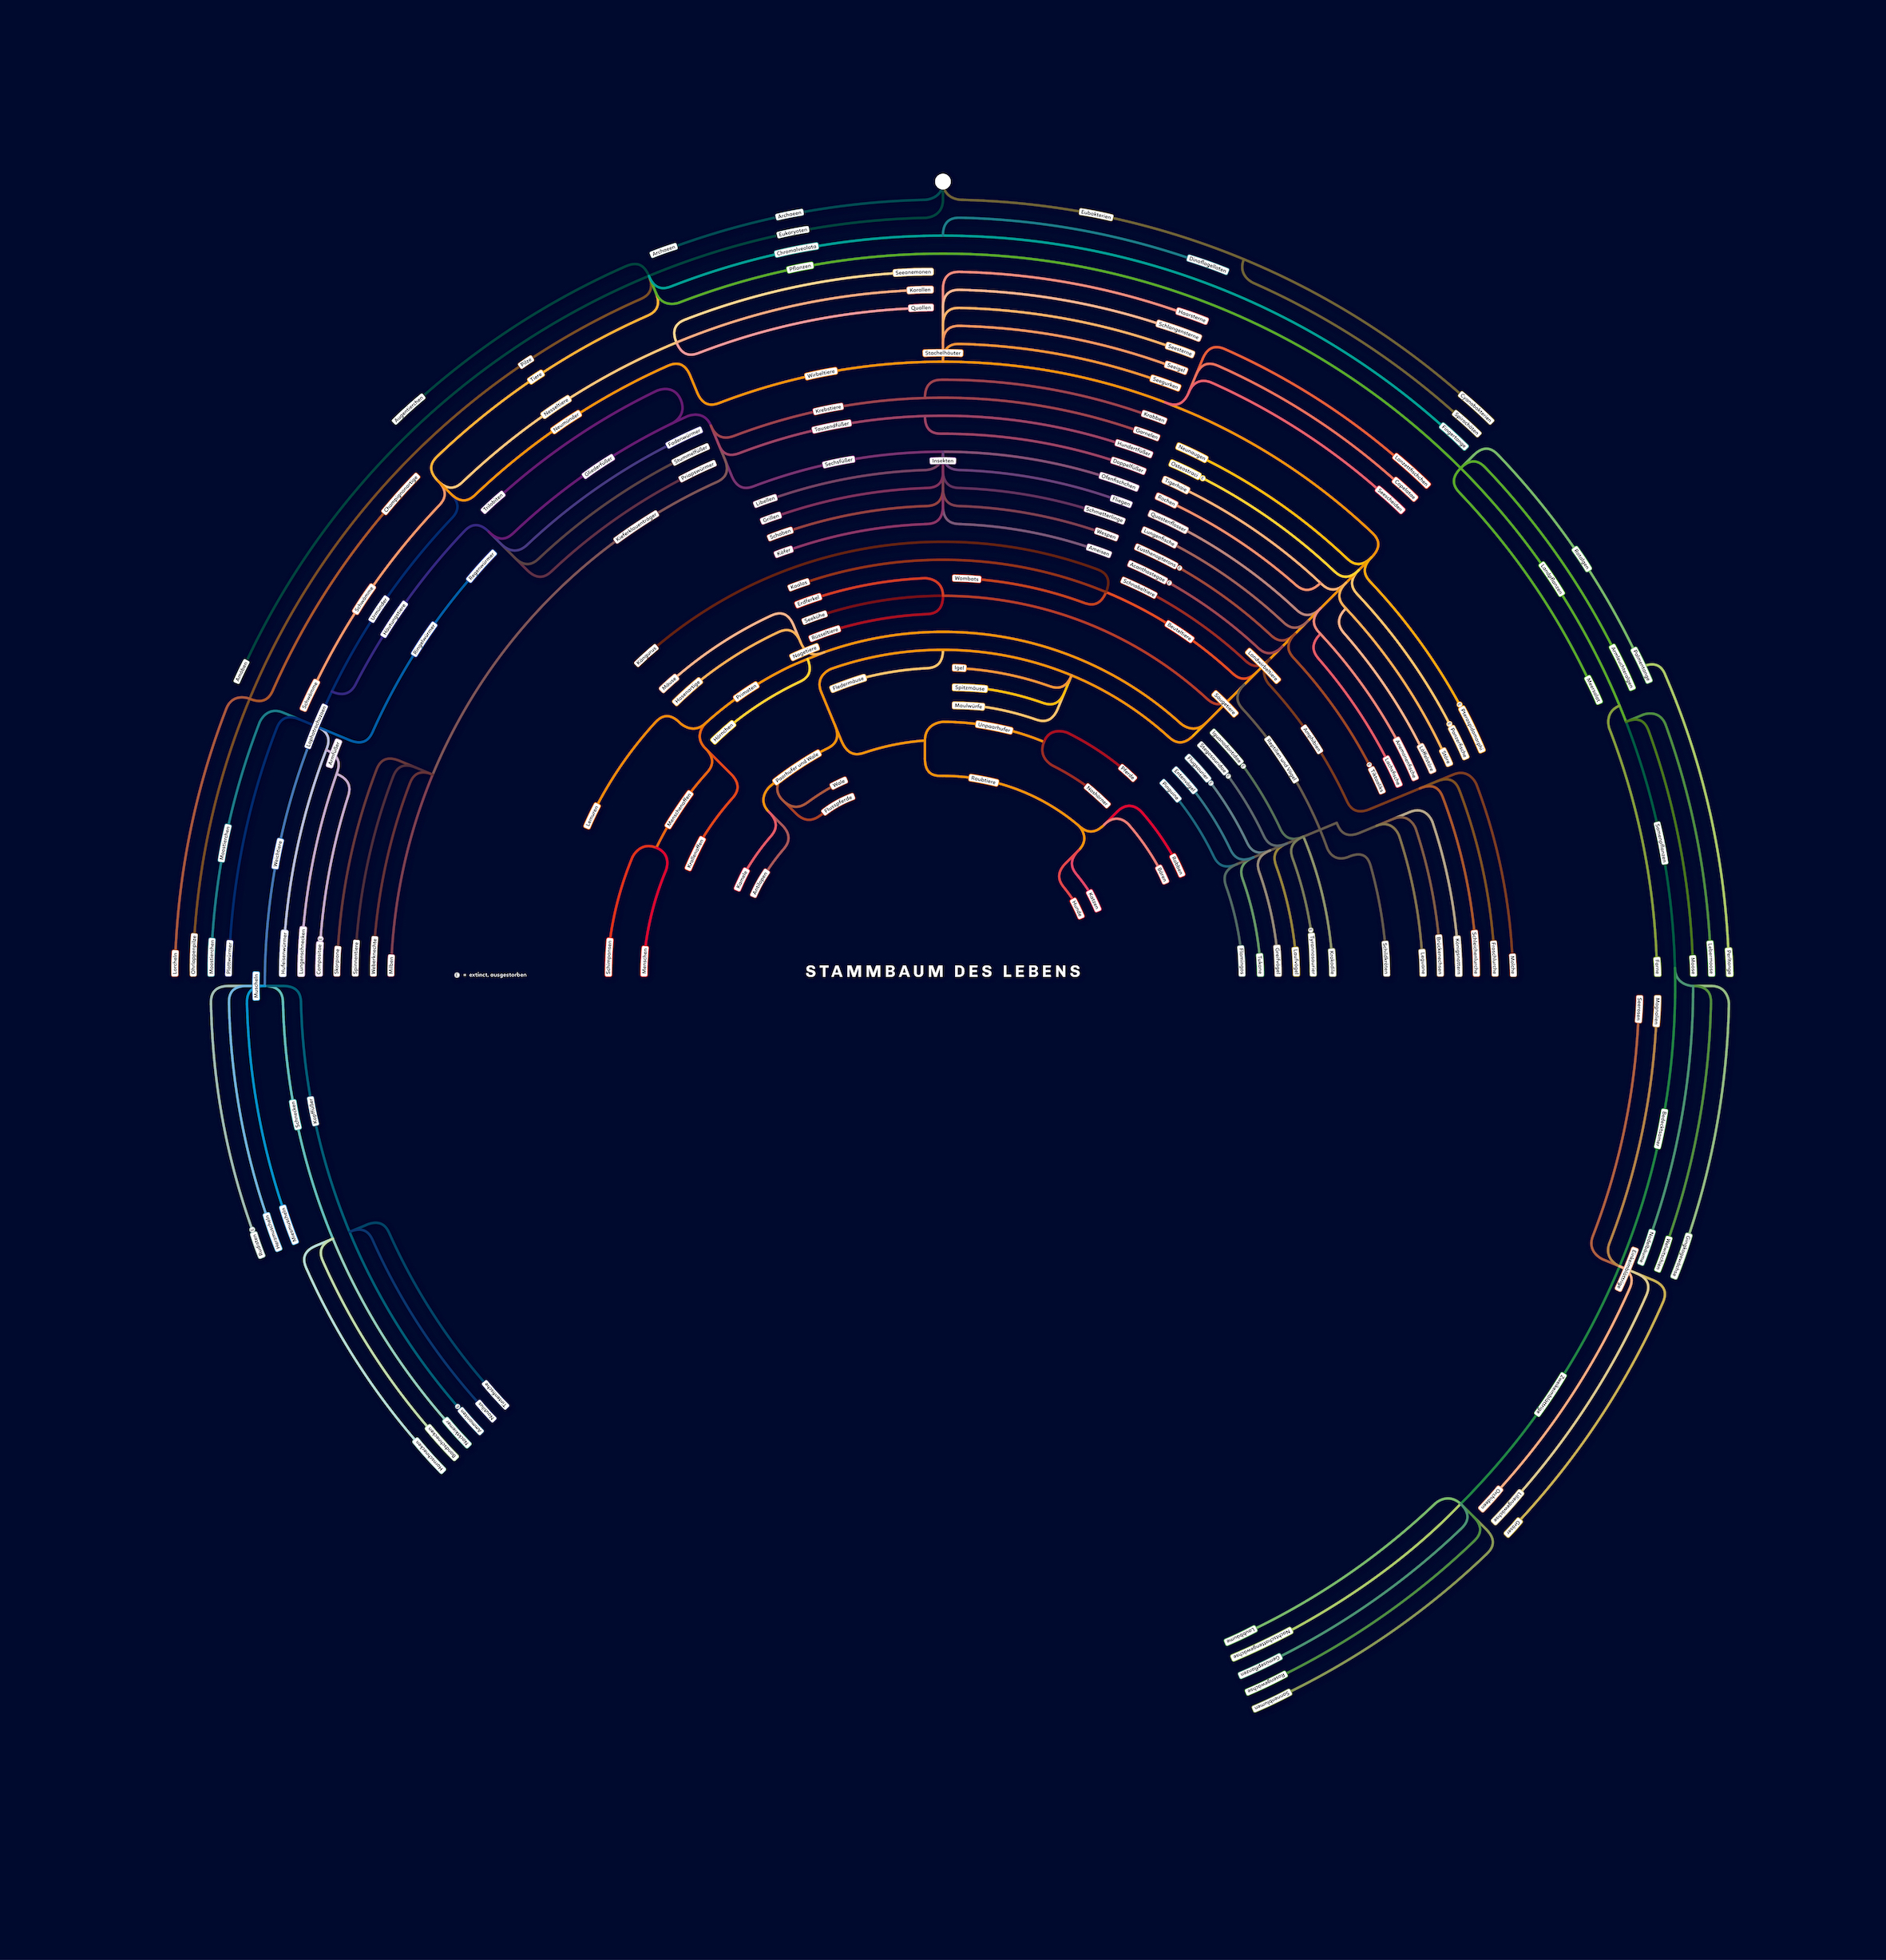
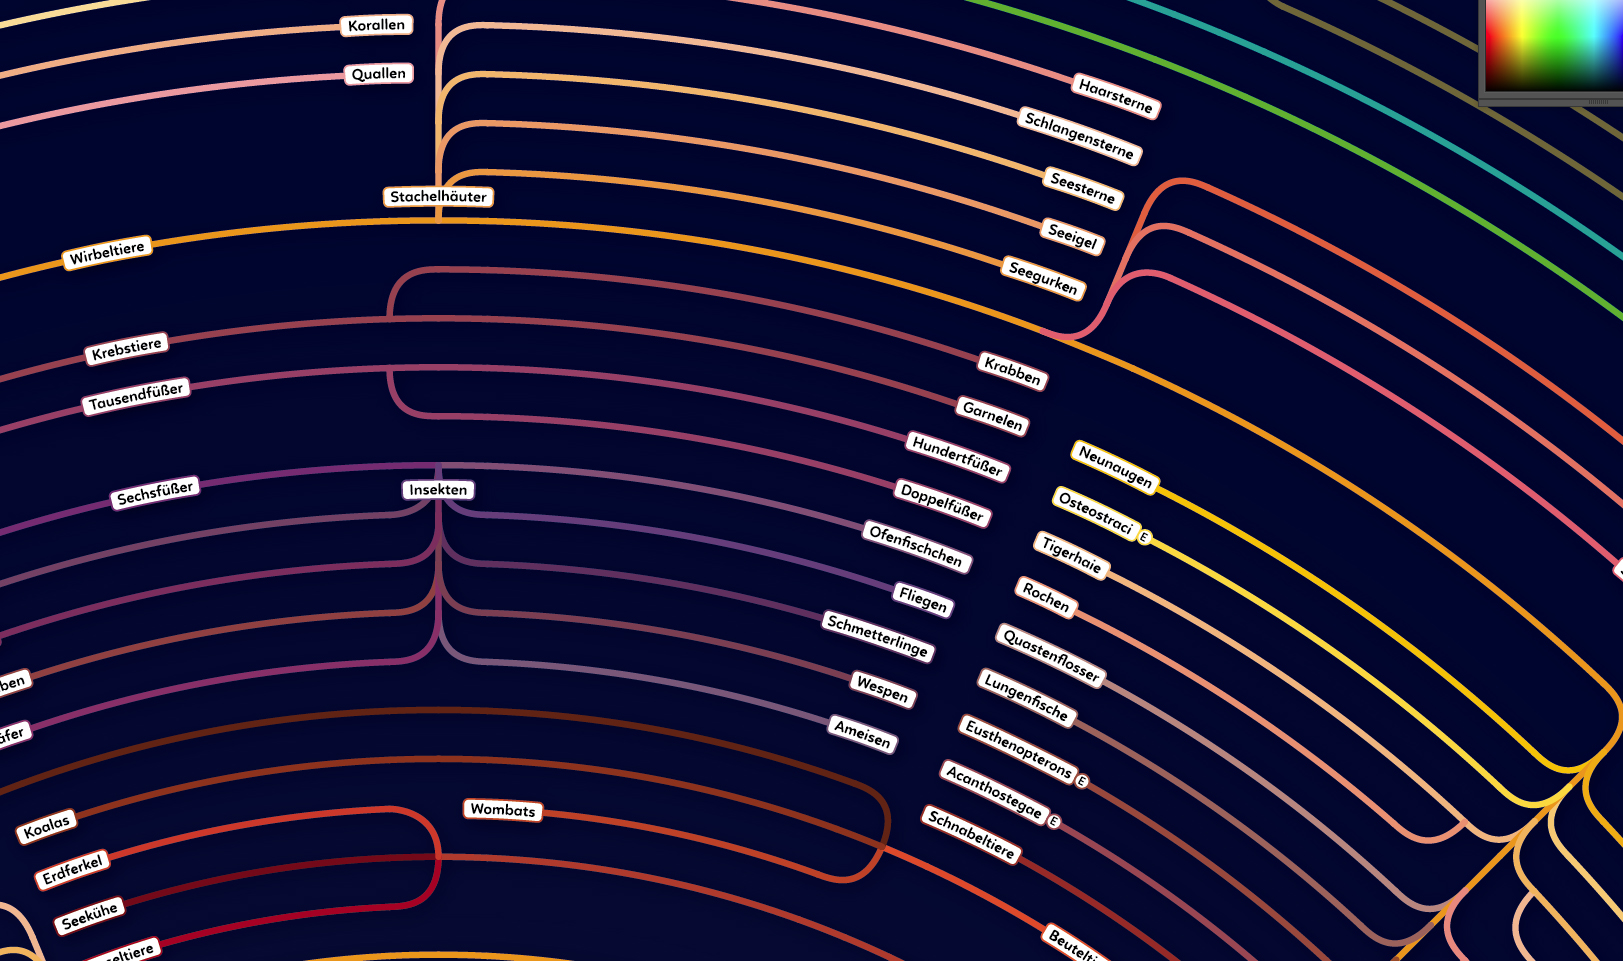
Genetic tree: Circular presentation of the pedigree of the evolution
︎
![]()